 輕松搭建ELK日志分析系統
一、ELK搭建篇
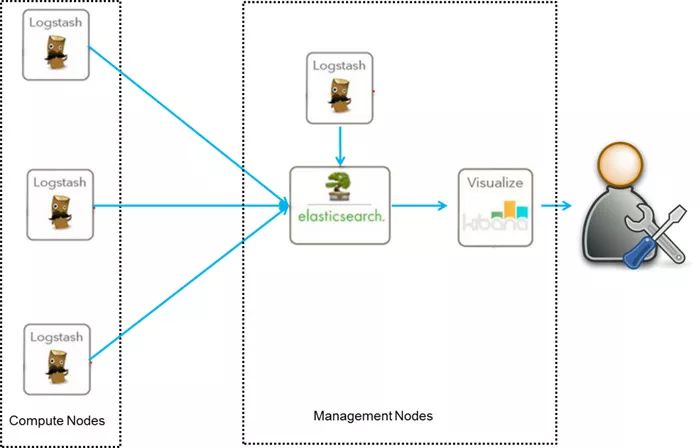
ELK是Elasticsearch、Logstash、Kibana的簡稱,這三者是核心套件,但并非全部。
Elasticsearch是實時全文搜索和分析引擎,提供搜集、分析、存儲數據三大功能;是一套開放REST和JAVA API等結構提供高效搜索功能,可擴展的分布式系統。它構建于Apache Lucene搜索引擎庫之上。
Logstash是一個用來搜集、分析、過濾日志的工具。它支持幾乎任何類型的日志,包括系統日志、錯誤日志和自定義應用程序日志。它可以從許多來源接收日志,這些來源包括 syslog、消息傳遞(例如 RabbitMQ)和JMX,它能夠以多種方式輸出數據,包括電子郵件、websockets和Elasticsearch。
Kibana是一個基于Web的圖形界面,用于搜索、分析和可視化存儲在 Elasticsearch指標中的日志數據。它利用Elasticsearch的REST接口來檢索數據,不僅允許用戶創建他們自己的數據的定制儀表板視圖,還允許他們以特殊的方式查詢和過濾數據
環境
Centos6.5 兩臺IP:192.168.1.202 安裝: elasticsearch、logstash、Kibana、Nginx、Http、Redis 192.168.1.201 安裝: logstash
安裝
安裝elasticsearch的yum源的密鑰(這個需要在所有服務器上都配置)# rpm --import https://artifacts.elastic.co/GPG-KEY-elasticsearch配置elasticsearch的yum源# vim /etc/yum.repos.d/elasticsearch.repo在elasticsearch.repo文件中添加如下內容[elasticsearch-5.x]name=Elasticsearch repository for 5.x packagesbaseurl=https://artifacts.elastic.co/packages/5.x/yumgpgcheck=1gpgkey=https://artifacts.elastic.co/GPG-KEY-elasticsearchenabled=1autorefresh=1type=rpm-md
安裝elasticsearch的環境
安裝elasticsearch# yum install -y elasticsearch安裝java環境(java環境必須是1.8版本以上的)wget http://download.oracle.com/otn-pub/java/jdk/8u131-b11/d54c1d3a095b4ff2b6607d096fa80163/jdk-8u131-linux-x64.rpmrpm -ivh jdk-8u131-linux-x64.rpm 驗證java安裝成功java -versionjava version "1.8.0_131"Java(TM) SE Runtime Environment (build 1.8.0_131-b11)Java HotSpot(TM) 64-Bit Server VM (build 25.131-b11, mixed mode)
創建elasticsearch data的存放目錄,并修改該目錄的屬主屬組
# mkdir -p /data/es-data (自定義用于存放data數據的目錄)# chown -R elasticsearch:elasticsearch /data/es-data
修改elasticsearch的日志屬主屬組
# chown -R elasticsearch:elasticsearch /var/log/elasticsearch/
修改elasticsearch的配置文件
# vim /etc/elasticsearch/elasticsearch.yml找到配置文件中的cluster.name,打開該配置并設置集群名稱cluster.name: demon找到配置文件中的node.name,打開該配置并設置節點名稱node.name: elk-1修改data存放的路徑path.data: /data/es-data修改logs日志的路徑path.logs: /var/log/elasticsearch/配置內存使用用交換分區bootstrap.memory_lock: true監聽的網絡地址network.host: 0.0.0.0開啟監聽的端口http.port: 9200增加新的參數,這樣head插件可以訪問es (5.x版本,如果沒有可以自己手動加)http.cors.enabled: truehttp.cors.allow-origin: "*"啟動elasticsearch服務
啟動服務
/etc/init.d/elasticsearch startStarting elasticsearch: Java HotSpot(TM) 64-Bit Server VM warning: INFO: os::commit_memory(0x0000000085330000, 2060255232, 0) failed; error='Cannot allocate memory' (errno=12)## There is insufficient memory for the Java Runtime Environment to continue.# Native memory allocation (mmap) failed to map 2060255232 bytes for committing reserved memory.# An error report file with more information is saved as:# /tmp/hs_err_pid2616.log [FAILED]這個報錯是因為默認使用的內存大小為2G,虛擬機沒有那么多的空間修改參數:vim /etc/elasticsearch/jvm.options-Xms512m-Xmx512m再次啟動/etc/init.d/elasticsearch start查看服務狀態,如果有報錯可以去看錯誤日志 less /var/log/elasticsearch/demon.log(日志的名稱是以集群名稱命名的)創建開機自啟動服務# chkconfig elasticsearch on
注意事項
需要修改幾個參數,不然啟動會報錯vim /etc/security/limits.conf在末尾追加以下內容(elk為啟動用戶,當然也可以指定為*)elk soft nofile 65536elk hard nofile 65536elk soft nproc 2048elk hard nproc 2048elk soft memlock unlimitedelk hard memlock unlimited繼續再修改一個參數vim /etc/security/limits.d/90-nproc.conf將里面的1024改為2048(ES最少要求為2048)* soft nproc 2048另外還需注意一個問題(在日志發現如下內容,這樣也會導致啟動失敗,這一問題困擾了很久)[2017-06-14T19:19:01,641][INFO ][o.e.b.BootstrapChecks ] [elk-1] bound or publishing to a non-loopback or non-link-local address, enforcing bootstrap checks[2017-06-14T19:19:01,658][ERROR][o.e.b.Bootstrap ] [elk-1] node validation exception[1] bootstrap checks failed[1]: system call filters failed to install; check the logs and fix your configuration or disable system call filters at your own risk 解決:修改配置文件,在配置文件添加一項參數(目前還沒明白此參數的作用)vim /etc/elasticsearch/elasticsearch.yml bootstrap.system_call_filter: false
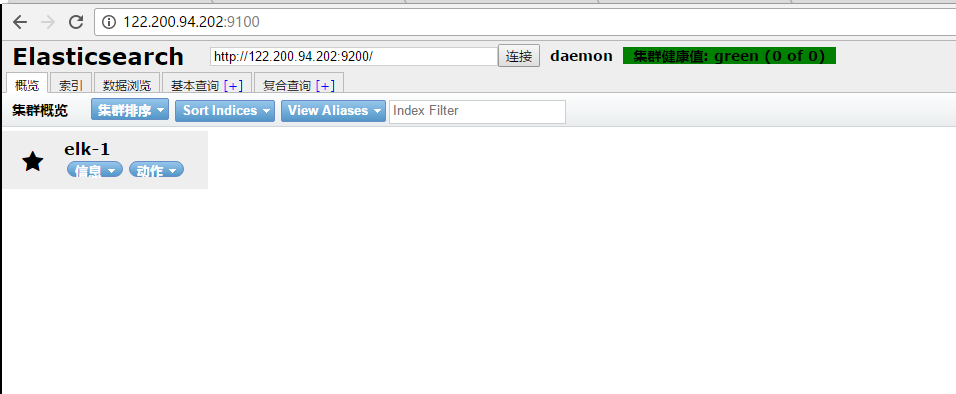
通過瀏覽器請求下9200的端口,看下是否成功
先檢查9200端口是否起來netstat -antp |grep 9200tcp 0 0 :::9200 :::* LISTEN 2934/java瀏覽器訪問測試是否正常(以下為正常)# curl http://127.0.0.1:9200/{ "name" : "linux-node1", "cluster_name" : "demon", "cluster_uuid" : "kM0GMFrsQ8K_cl5Fn7BF-g", "version" : { "number" : "5.4.0", "build_hash" : "780f8c4", "build_date" : "2017-04-28T17:43:27.229Z", "build_snapshot" : false, "lucene_version" : "6.5.0" }, "tagline" : "You Know, for Search"}
如何和elasticsearch交互
JavaAPIRESTful APIJavascript,.Net,PHP,Perl,Python利用API查看狀態# curl -i -XGET 'localhost:9200/_count?pretty' HTTP/1.1 200 OK content-type: application/json; charset=UTF-8 content-length: 95 { "count" : 0, "_shards" : { "total" : 0, "successful" : 0, "failed" : 0 } }
安裝插件
安裝elasticsearch-head插件安裝docker鏡像或者通過github下載elasticsearch-head項目都是可以的,1或者2兩種方式選擇一種安裝使用即可1. 使用docker的集成好的elasticsearch-head # docker run -p 9100:9100 mobz/elasticsearch-head:5 docker容器下載成功并啟動以后,運行瀏覽器打開http://localhost:9100/2. 使用git安裝elasticsearch-head # yum install -y npm # git clone git://github.com/mobz/elasticsearch-head.git # cd elasticsearch-head # npm install # npm run start 檢查端口是否起來 netstat -antp |grep 9100 瀏覽器訪問測試是否正常 http://IP:9100/
LogStash的使用
安裝Logstash環境:官方安裝手冊:https://www.elastic.co/guide/en/logstash/current/installing-logstash.html下載yum源的密鑰認證:# rpm --import https://artifacts.elastic.co/GPG-KEY-elasticsearch利用yum安裝logstash# yum install -y logstash查看下logstash的安裝目錄# rpm -ql logstash創建一個軟連接,每次執行命令的時候不用在寫安裝路勁(默認安裝在/usr/share下)ln -s /usr/share/logstash/bin/logstash /bin/執行logstash的命令# logstash -e 'input { stdin { } } output { stdout {} }'運行成功以后輸入:nihaostdout返回的結果:
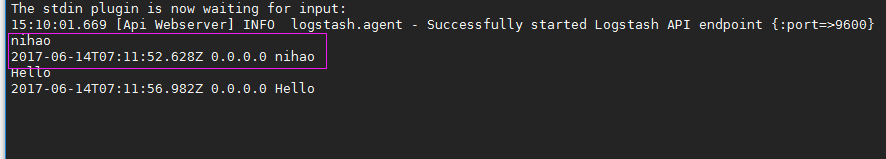
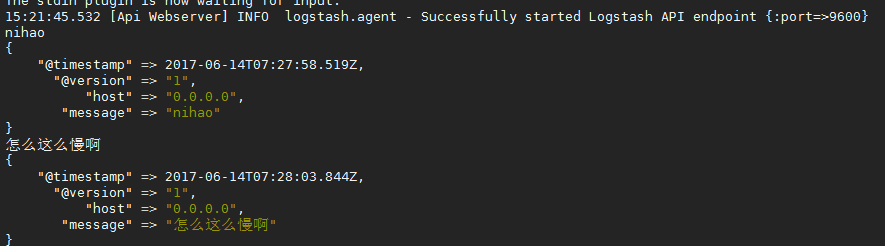
注: -e 執行操作 input 標準輸入 { input } 插件 output 標準輸出 { stdout } 插件 通過rubydebug來輸出下更詳細的信息# logstash -e 'input { stdin { } } output { stdout {codec => rubydebug} }'執行成功輸入:nihaostdout輸出的結果:
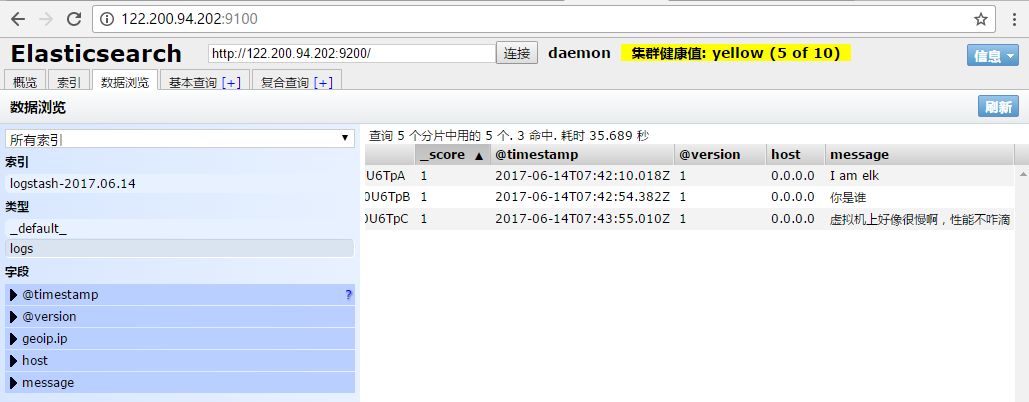
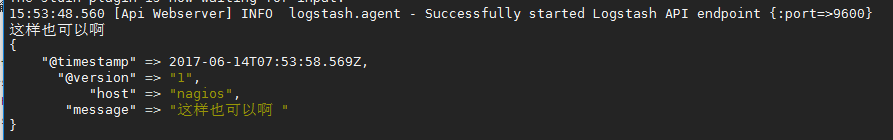
如果標準輸出還有elasticsearch中都需要保留應該怎么玩,看下面# /usr/share/logstash/bin/logstash -e 'input { stdin { } } output { elasticsearch { hosts => ["192.168.1.202:9200"] } stdout { codec => rubydebug }}'運行成功以后輸入:I am elk返回的結果(標準輸出中的結果):
logstash使用配置文件
官方指南:https://www.elastic.co/guide/en/logstash/current/configuration.html創建配置文件01-logstash.conf# vim /etc/logstash/conf.d/elk.conf文件中添加以下內容input { stdin { } }output { elasticsearch { hosts => ["192.168.1.202:9200"] } stdout { codec => rubydebug }}使用配置文件運行logstash# logstash -f ./elk.conf運行成功以后輸入以及標準輸出結果
logstash的數據庫類型
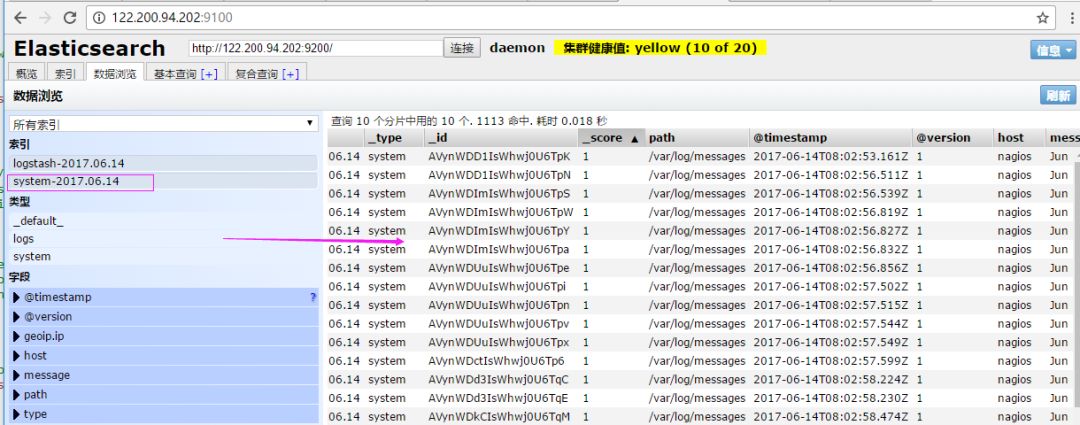
1. Input插件 權威指南:https://www.elastic.co/guide/en/logstash/current/input-plugins.html file插件的使用 # vim /etc/logstash/conf.d/elk.conf 添加如下配置 input { file { path => "/var/log/messages" type => "system" start_position => "beginning" } } output { elasticsearch { hosts => ["192.168.1.202:9200"] index => "system-%{+YYYY.MM.dd}" } }運行logstash指定elk.conf配置文件,進行過濾匹配#logstash -f /etc/logstash/conf.d/elk.conf
來一發配置安全日志的并且把日志的索引按類型做存放,繼續編輯elk.conf文件
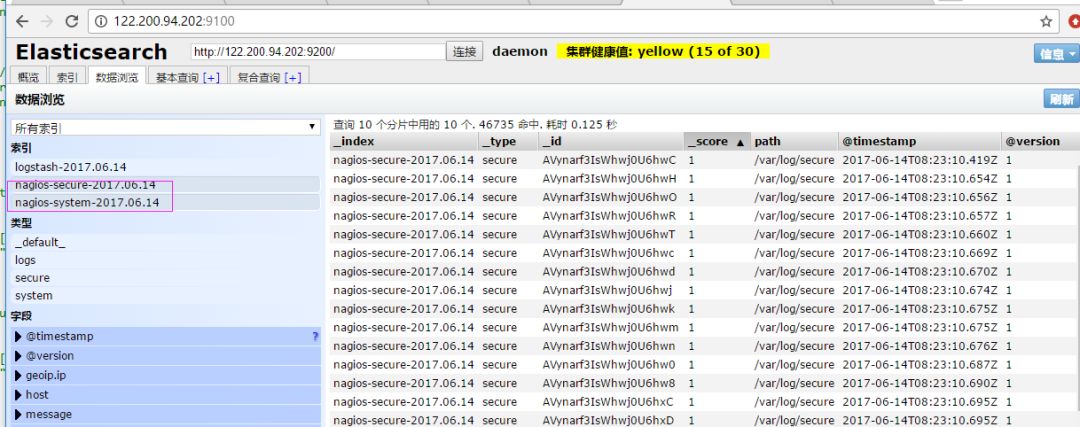
# vim /etc/logstash/conf.d/elk.conf添加secure日志的路徑input { file { path => "/var/log/messages" type => "system" start_position => "beginning" } file { path => "/var/log/secure" type => "secure" start_position => "beginning" }}output { if [type] == "system" { elasticsearch { hosts => ["192.168.1.202:9200"] index => "nagios-system-%{+YYYY.MM.dd}" } } if [type] == "secure" { elasticsearch { hosts => ["192.168.1.202:9200"] index => "nagios-secure-%{+YYYY.MM.dd}" } }}運行logstash指定elk.conf配置文件,進行過濾匹配# logstash -f ./elk.conf
這些設置都沒有問題之后,接下來安裝下kibana,可以讓在前臺展示
Kibana的安裝及使用
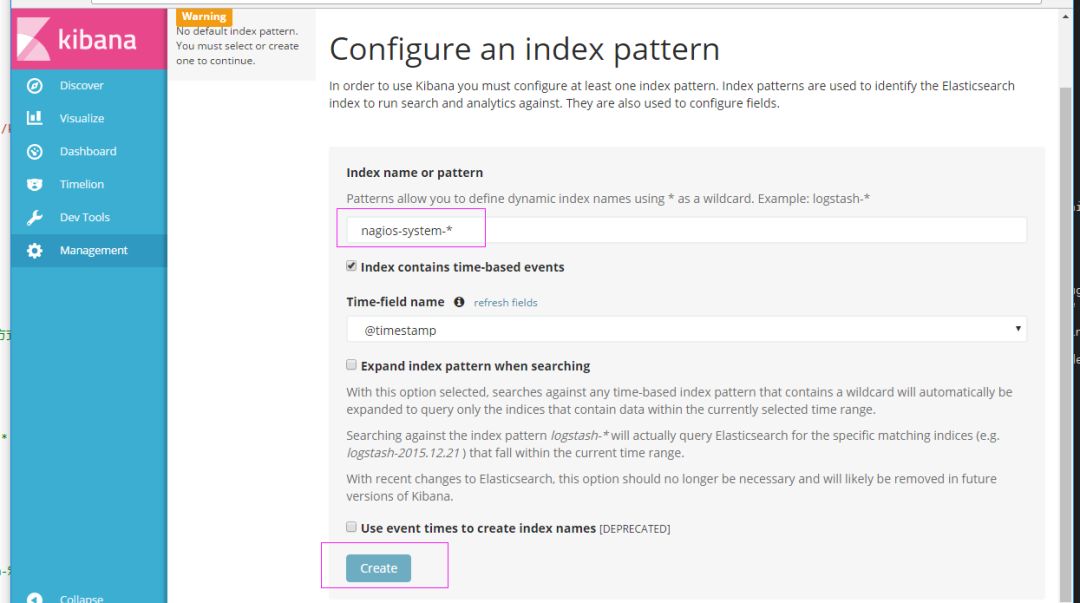
安裝kibana環境官方安裝手冊:https://www.elastic.co/guide/en/kibana/current/install.html下載kibana的tar.gz的軟件包# wget https://artifacts.elastic.co/downloads/kibana/kibana-5.4.0-linux-x86_64.tar.gz解壓kibana的tar包# tar -xzf kibana-5.4.0-linux-x86_64.tar.gz進入解壓好的kibana# mv kibana-5.4.0-linux-x86_64 /usr/local創建kibana的軟連接# ln -s /usr/local/kibana-5.4.0-linux-x86_64/ /usr/local/kibana 編輯kibana的配置文件# vim /usr/local/kibana/config/kibana.yml修改配置文件如下,開啟以下的配置server.port: 5601server.host: "0.0.0.0"elasticsearch.url: "http://192.168.1.202:9200"kibana.index: ".kibana" 安裝screen,以便于kibana在后臺運行(當然也可以不用安裝,用其他方式進行后臺啟動)# yum -y install screen# screen# /usr/local/kibana/bin/kibananetstat -antp |grep 5601tcp 0 0 0.0.0.0:5601 0.0.0.0:* LISTEN 17007/node 打開瀏覽器并設置對應的indexhttp://IP:5601
二、ELK實戰篇
好,現在索引也可以創建了,現在可以來輸出nginx、apache、message、secrue的日志到前臺展示(Nginx有的話直接修改,沒有自行安裝)
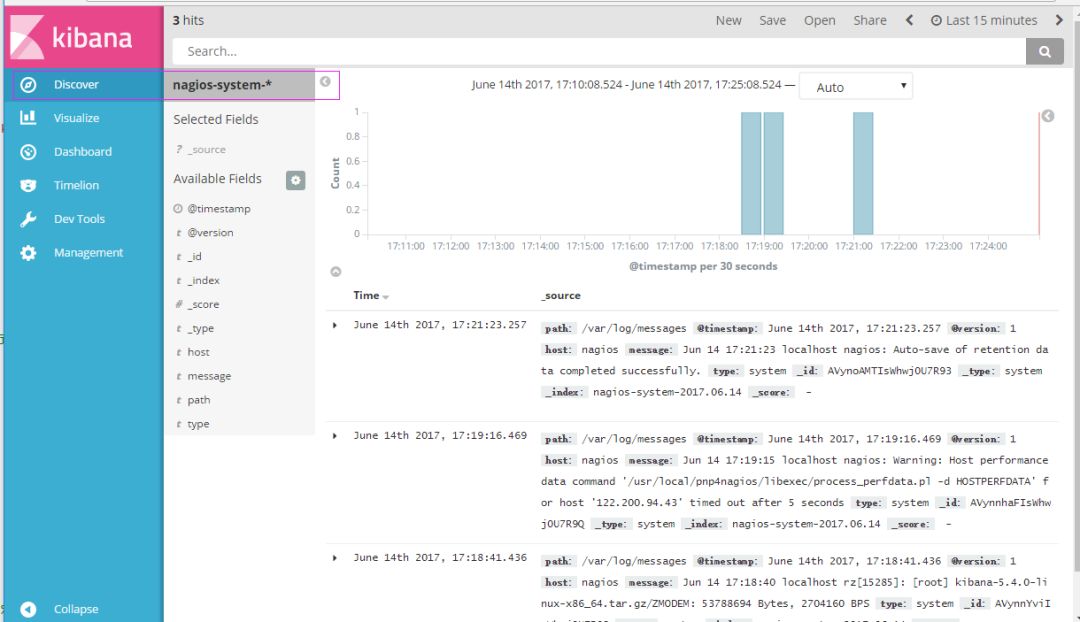
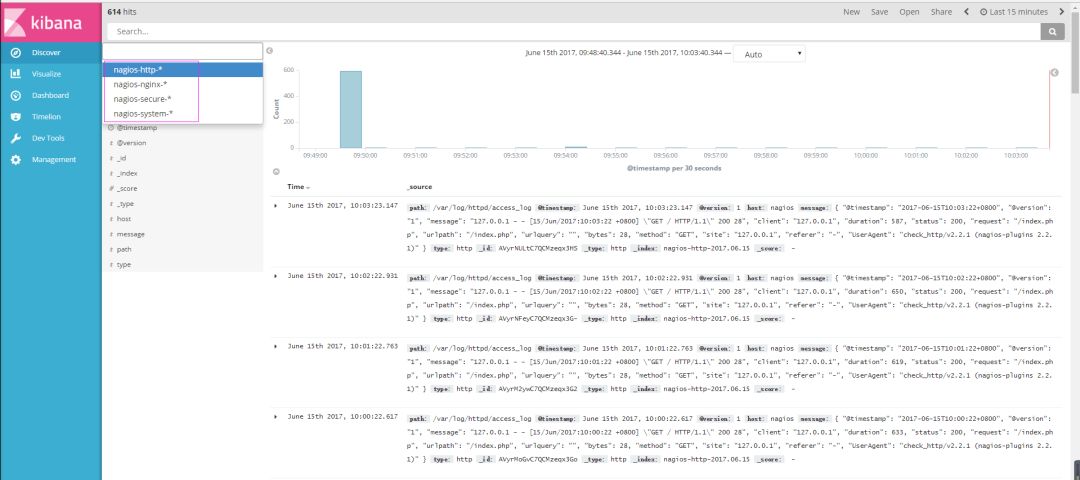
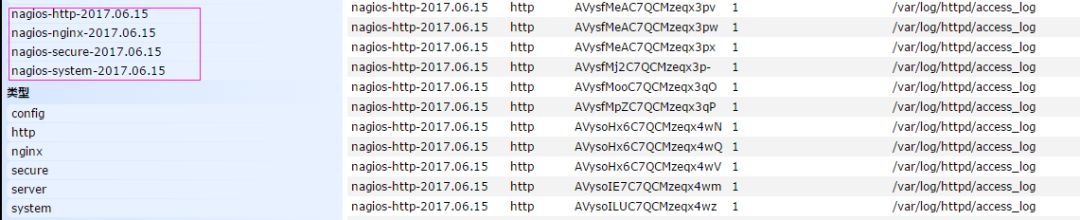
編輯nginx配置文件,修改以下內容(在http模塊下添加)log_format json '{"@timestamp":"$time_iso8601",' '"@version":"1",' '"client":"$remote_addr",' '"url":"$uri",' '"status":"$status",' '"domian":"$host",' '"host":"$server_addr",' '"size":"$body_bytes_sent",' '"responsetime":"$request_time",' '"referer":"$http_referer",' '"ua":"$http_user_agent"' '}';修改access_log的輸出格式為剛才定義的json access_log logs/elk.access.log json;繼續修改apache的配置文件LogFormat "{ \ "@timestamp": "%{%Y-%m-%dT%H:%M:%S%z}t", \ "@version": "1", \ "tags":["apache"], \ "message": "%h %l %u %t \\"%r\\" %>s %b", \ "clientip": "%a", \ "duration": %D, \ "status": %>s, \ "request": "%U%q", \ "urlpath": "%U", \ "urlquery": "%q", \ "bytes": %B, \ "method": "%m", \ "site": "%{Host}i", \ "referer": "%{Referer}i", \ "useragent": "%{User-agent}i" \ }" ls_apache_json一樣修改輸出格式為上面定義的json格式CustomLog logs/access_log ls_apache_json編輯logstash配置文件,進行日志收集vim /etc/logstash/conf.d/full.conf input { file { path => "/var/log/messages" type => "system" start_position => "beginning" } file { path => "/var/log/secure" type => "secure" start_position => "beginning" } file { path => "/var/log/httpd/access_log" type => "http" start_position => "beginning" } file { path => "/usr/local/nginx/logs/elk.access.log" type => "nginx" start_position => "beginning" } } output { if [type] == "system" { elasticsearch { hosts => ["192.168.1.202:9200"] index => "nagios-system-%{+YYYY.MM.dd}" } } if [type] == "secure" { elasticsearch { hosts => ["192.168.1.202:9200"] index => "nagios-secure-%{+YYYY.MM.dd}" } } if [type] == "http" { elasticsearch { hosts => ["192.168.1.202:9200"] index => "nagios-http-%{+YYYY.MM.dd}" } } if [type] == "nginx" { elasticsearch { hosts => ["192.168.1.202:9200"] index => "nagios-nginx-%{+YYYY.MM.dd}" } }}運行看看效果如何logstash -f /etc/logstash/conf.d/full.conf
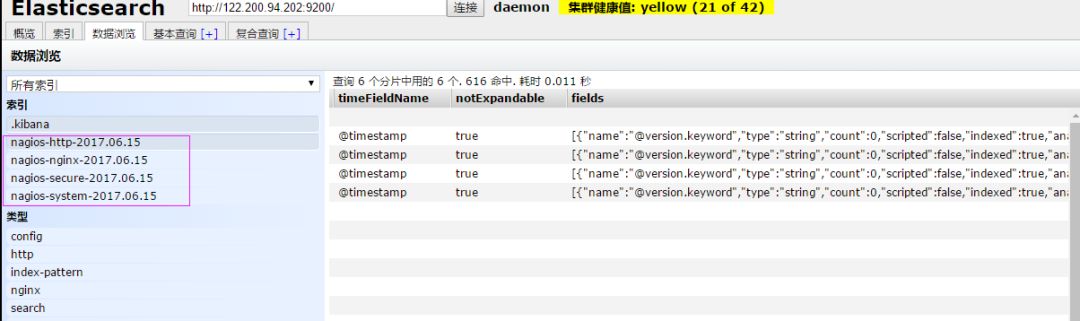
可以發現所有創建日志的索引都已存在,接下來就去Kibana創建日志索引,進行展示(按照上面的方法進行創建索引即可),看下展示的效果
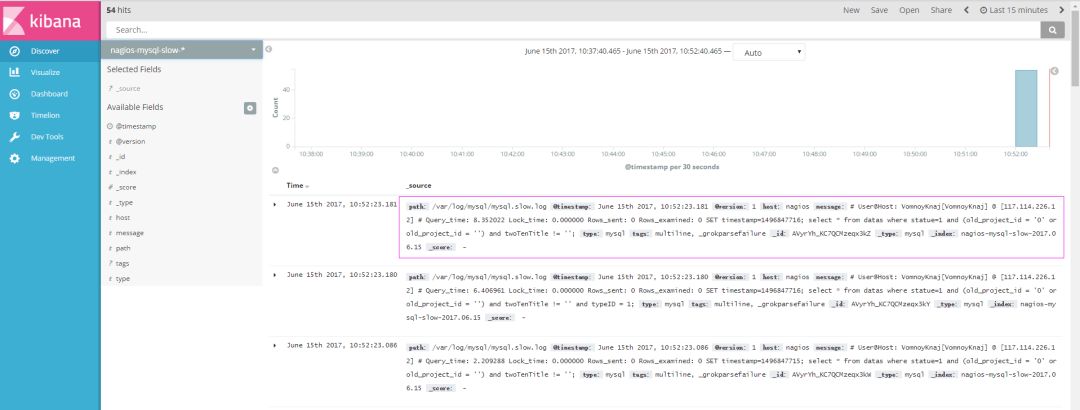
接下來再來一發MySQL慢日志的展示
由于MySQL的慢日志查詢格式比較特殊,所以需要用正則進行匹配,并使用multiline能夠進行多行匹配(看具體配置)input { file { path => "/var/log/messages" type => "system" start_position => "beginning" } file { path => "/var/log/secure" type => "secure" start_position => "beginning" } file { path => "/var/log/httpd/access_log" type => "http" start_position => "beginning" } file { path => "/usr/local/nginx/logs/elk.access.log" type => "nginx" start_position => "beginning" } file { path => "/var/log/mysql/mysql.slow.log" type => "mysql" start_position => "beginning" codec => multiline { pattern => "^# User@Host:" negate => true what => "previous" } }}filter { grok { match => { "message" => "SELECT SLEEP" } add_tag => [ "sleep_drop" ] tag_on_failure => [] } if "sleep_drop" in [tags] { drop {} } grok { match => { "message" => "(?m)^# User@Host: %{USER:User}\[[^\]]+\] @ (?:(?
查看效果(一條慢日志查詢會顯示一條,如果不進行正則匹配,那么一行就會顯示一條)
具體的日志輸出需求,進行具體的分析
三:ELK終極篇
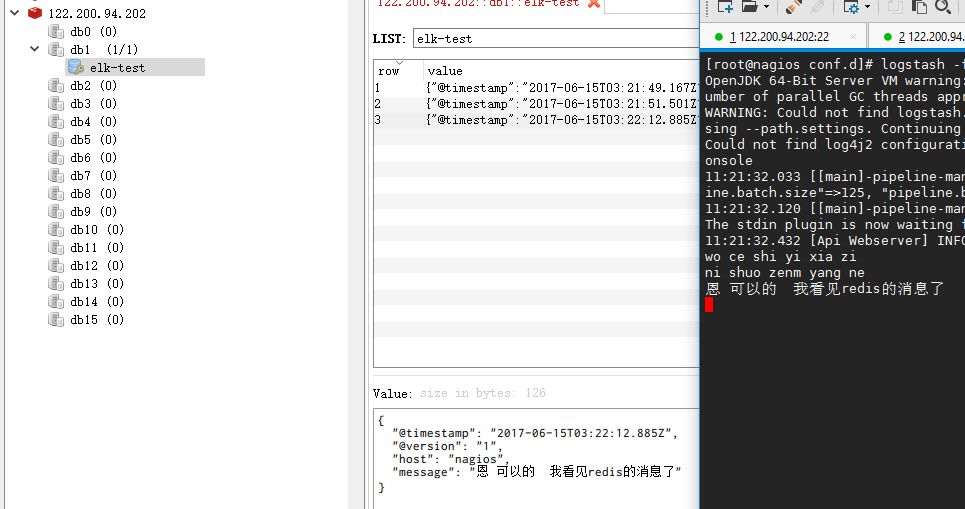
安裝reids # yum install -y redis修改redis的配置文件# vim /etc/redis.conf修改內容如下daemonize yesbind 192.168.1.202啟動redis服務# /etc/init.d/redis restart測試redis的是否啟用成功# redis-cli -h 192.168.1.202輸入info如果有不報錯即可redis 192.168.1.202:6379> inforedis_version:2.4.10....編輯配置redis-out.conf配置文件,把標準輸入的數據存儲到redis中# vim /etc/logstash/conf.d/redis-out.conf添加如下內容input { stdin {}}output { redis { host => "192.168.1.202" port => "6379" password => 'test' db => '1' data_type => "list" key => 'elk-test' }} 運行logstash指定redis-out.conf的配置文件# /usr/share/logstash/bin/logstash -f /etc/logstash/conf.d/redis-out.conf
運行成功以后,在logstash中輸入內容(查看下效果)
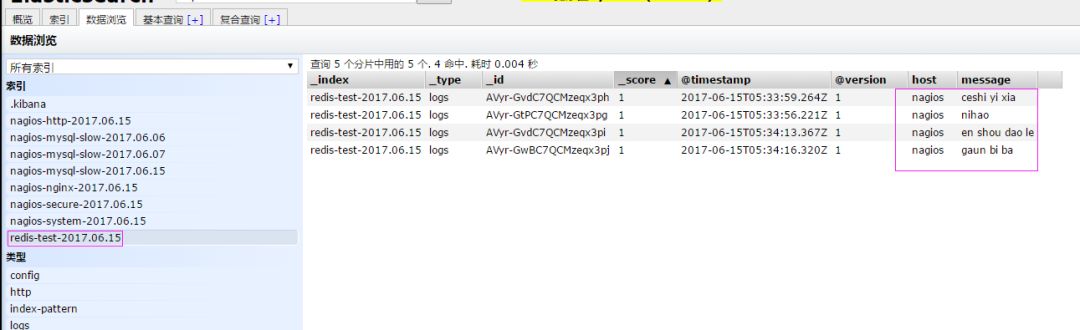
編輯配置redis-in.conf配置文件,把reids的存儲的數據輸出到elasticsearch中# vim /etc/logstash/conf.d/redis-out.conf添加如下內容input{ redis { host => "192.168.1.202" port => "6379" password => 'test' db => '1' data_type => "list" key => 'elk-test' batch_count => 1 #這個值是指從隊列中讀取數據時,一次性取出多少條,默認125條(如果redis中沒有125條,就會報錯,所以在測試期間加上這個值) }}output { elasticsearch { hosts => ['192.168.1.202:9200'] index => 'redis-test-%{+YYYY.MM.dd}' }}運行logstash指定redis-in.conf的配置文件# /usr/share/logstash/bin/logstash -f /etc/logstash/conf.d/redis-out.conf
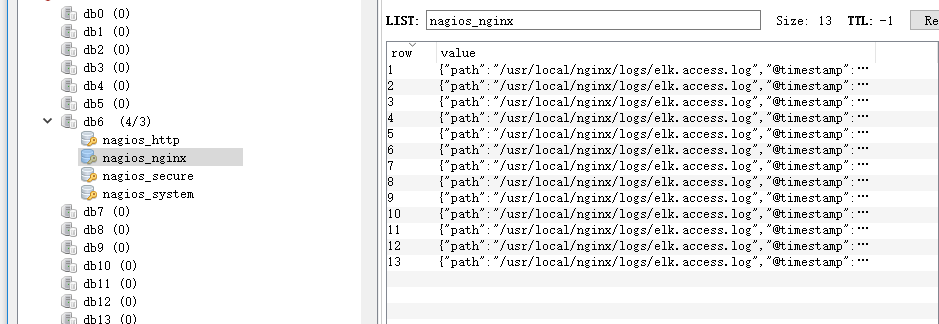
把之前的配置文件修改一下,變成所有的日志監控的來源文件都存放到redis中,然后通過redis在輸出到elasticsearch中更改為如下,編輯full.confinput { file { path => "/var/log/httpd/access_log" type => "http" start_position => "beginning" } file { path => "/usr/local/nginx/logs/elk.access.log" type => "nginx" start_position => "beginning" } file { path => "/var/log/secure" type => "secure" start_position => "beginning" } file { path => "/var/log/messages" type => "system" start_position => "beginning" }}output { if [type] == "http" { redis { host => "192.168.1.202" password => 'test' port => "6379" db => "6" data_type => "list" key => 'nagios_http' } } if [type] == "nginx" { redis { host => "192.168.1.202" password => 'test' port => "6379" db => "6" data_type => "list" key => 'nagios_nginx' } } if [type] == "secure" { redis { host => "192.168.1.202" password => 'test' port => "6379" db => "6" data_type => "list" key => 'nagios_secure' } } if [type] == "system" { redis { host => "192.168.1.202" password => 'test' port => "6379" db => "6" data_type => "list" key => 'nagios_system' } }} 運行logstash指定shipper.conf的配置文件# /usr/share/logstash/bin/logstash -f /etc/logstash/conf.d/full.conf在redis中查看是否已經將數據寫到里面(有時候輸入的日志文件不產生日志,會導致redis里面也沒有寫入日志)
把redis中的數據讀取出來,寫入到elasticsearch中(需要另外一臺主機做實驗)編輯配置文件# vim /etc/logstash/conf.d/redis-out.conf添加如下內容input { redis { type => "system" host => "192.168.1.202" password => 'test' port => "6379" db => "6" data_type => "list" key => 'nagios_system' batch_count => 1 } redis { type => "http" host => "192.168.1.202" password => 'test' port => "6379" db => "6" data_type => "list" key => 'nagios_http' batch_count => 1 } redis { type => "nginx" host => "192.168.1.202" password => 'test' port => "6379" db => "6" data_type => "list" key => 'nagios_nginx' batch_count => 1 } redis { type => "secure" host => "192.168.1.202" password => 'test' port => "6379" db => "6" data_type => "list" key => 'nagios_secure' batch_count => 1 }} output { if [type] == "system" { elasticsearch { hosts => ["192.168.1.202:9200"] index => "nagios-system-%{+YYYY.MM.dd}" } } if [type] == "http" { elasticsearch { hosts => ["192.168.1.202:9200"] index => "nagios-http-%{+YYYY.MM.dd}" } } if [type] == "nginx" { elasticsearch { hosts => ["192.168.1.202:9200"] index => "nagios-nginx-%{+YYYY.MM.dd}" } } if [type] == "secure" { elasticsearch { hosts => ["192.168.1.202:9200"] index => "nagios-secure-%{+YYYY.MM.dd}" } } }注意:input是從客戶端收集的output是同樣也保存到192.168.1.202中的elasticsearch中,如果要保存到當前的主機上,可以把output中的hosts修改成localhost,如果還需要在kibana中顯示,需要在本機上部署kabana,為何要這樣做,起到一個松耦合的目的說白了,就是在客戶端收集日志,寫到服務端的redis里或是本地的redis里面,輸出的時候對接ES服務器即可運行命令看看效果# /usr/share/logstash/bin/logstash -f /etc/logstash/conf.d/redis-out.conf
效果是和直接往ES服務器輸出一樣的(這樣是先將日志存到redis數據庫,然后再從redis數據庫里取出日志)
上線ELK
1.日志分類 系統日志 rsyslog logstash syslog插件 訪問日志 nginx logstash codec json 錯誤日志 file logstash mulitline 運行日志 file logstash codec json 設備日志 syslog logstash syslog插件 Debug日志 file logstash json 或者 mulitline 2. 日志標準化 路徑 固定 格式 盡量json3. 系統個日志開始-->錯誤日志-->運行日志-->訪問日志
因為ES保存日志是永久保存,所以需要定期刪除一下日志,下面命令為刪除指定時間前的日志
curl -X DELETE http://xx.xx.com:9200/logstash-*-`date +%Y-%m-%d -d "-$n days"`
-
Web
+關注
關注
2文章
1269瀏覽量
69730 -
JAVA
+關注
關注
19文章
2974瀏覽量
105138
原文標題:10 分鐘快速搭建 ELK 日志分析系統
文章出處:【微信號:magedu-Linux,微信公眾號:馬哥Linux運維】歡迎添加關注!文章轉載請注明出處。
發布評論請先 登錄
相關推薦
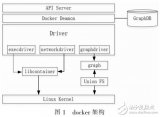
基于DOCKER容器的ELK日志收集系統分析
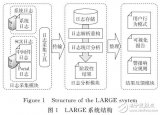
對于大規模系統日志的日志模式提煉算法的優化
基于Hadoop與聚類分析的網絡日志分析模型

NAS日志分析用戶指南

分布式實時日志分析解決方案ELK部署架構
基于 Elasticsearch 的日志系統架構如何面臨挑戰

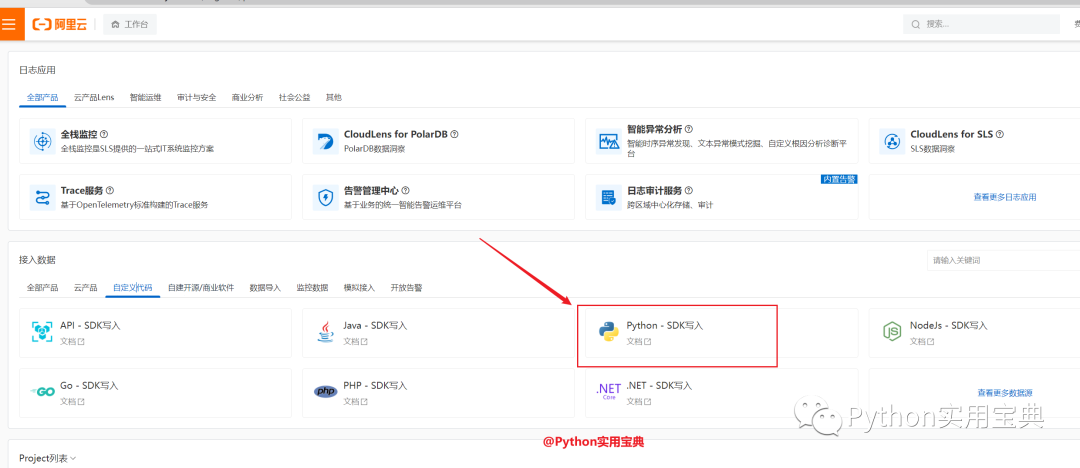
如何通過阿里云日志服務搭建一套通過Python上傳日志的監控服務
企業如何用ELK技術棧實現數據流量爆炸式增長


 工商網監
工商網監
評論